Affiliation: King's College London
Clare Birchall
Organising Participation with Air Pollution Data
How can air pollution sensors be used by various actors for public purposes beyond scientific measurement and policy management? This project explores how air pollution devices and data can be used to facilitate and organise public participation around the issue of air pollution in various ways, from gathering publics to inviting action to inventive performances.
Image: “Yellow Dust” by In The Air.
MiniVAN
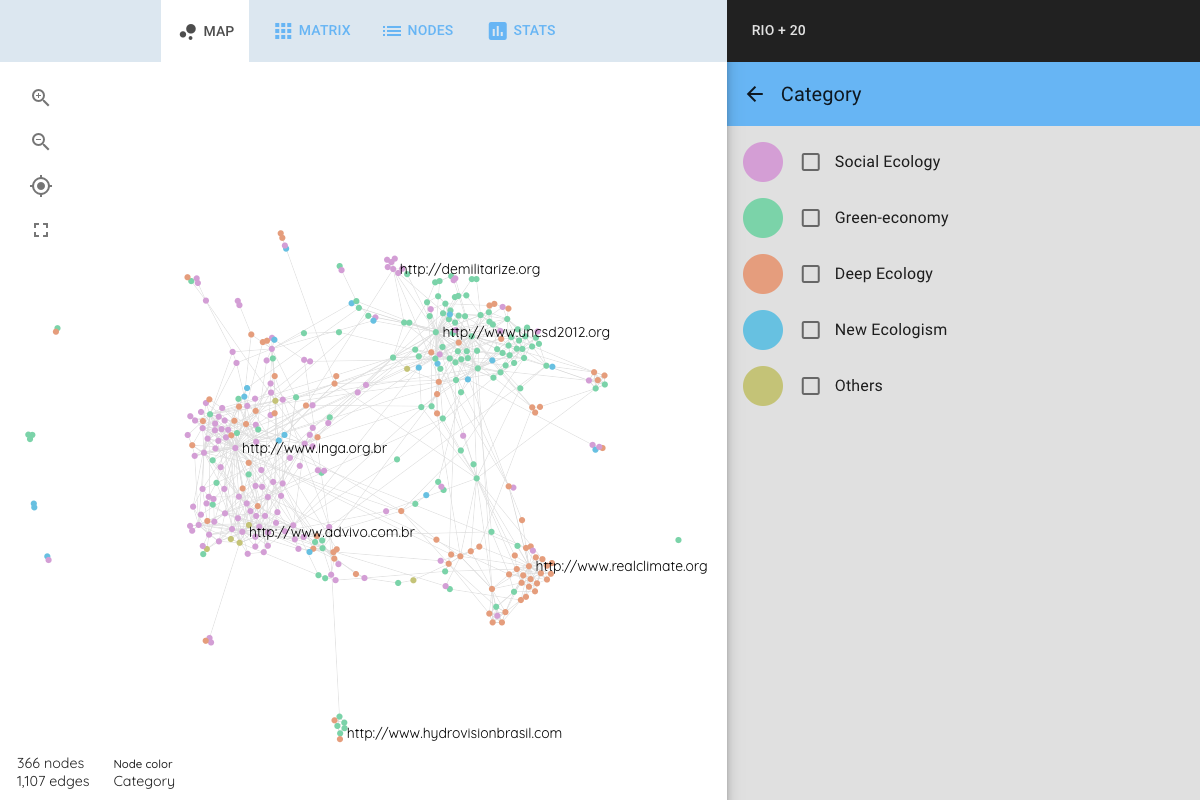
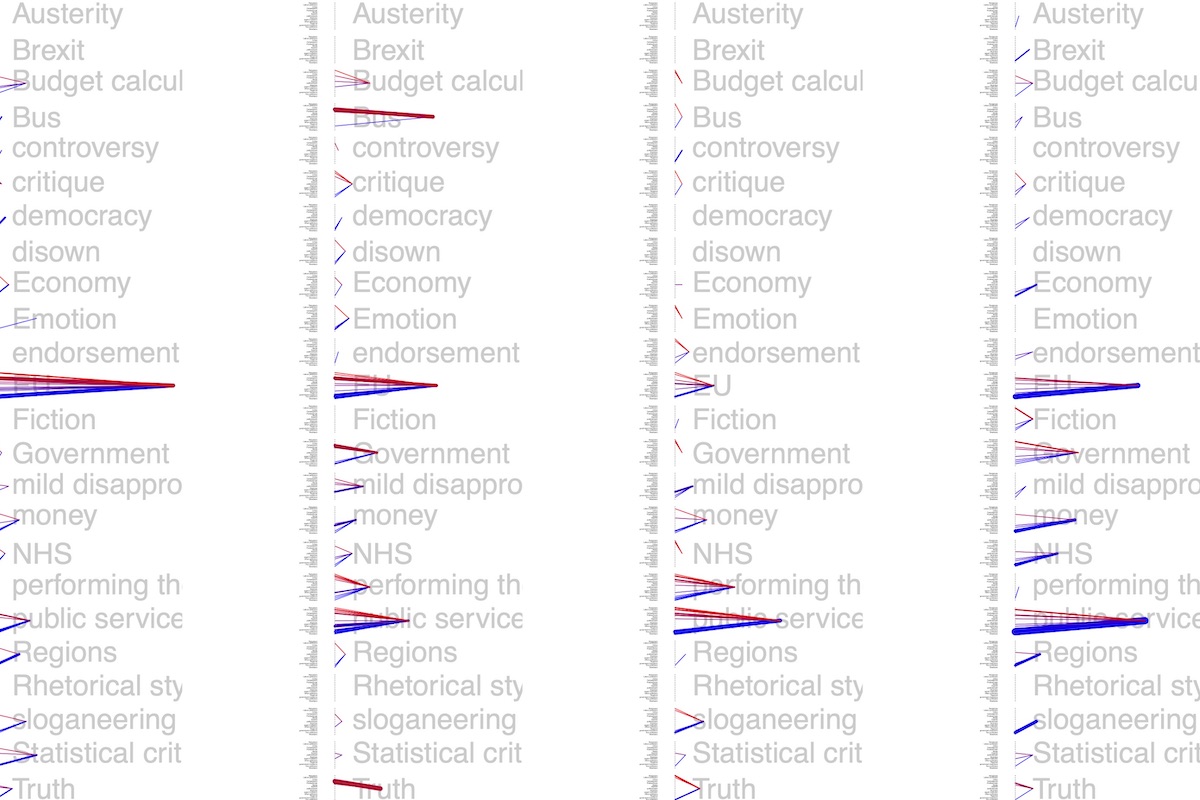
Networks are increasingly popular in the social sciences and in the humanities as interfaces for exploratory data analysis. “Visual Networks Analysis” (or VNA) allows scholars to analyse large relational datasets without having to deal with the full complexity of graph mathematics.
Current VNA tools, however, are either too complicated or unable to handle large datasets. Hence MiniVAN, a VNA tool, accessible to scholars with little knowledge of mathematics or coding and yet capable to scale up to graphs of several thousands of nodes.
MiniVAN draws on previous open source (gephi.org, sigmajs.org, graphology.github.io) and research projects (climaps.eu and fakenews.publicdatalab.org).
MiniVAN is a project of the Public Data Lab with support from Sage Ocean Concept Grant.
You can read more about the project in this interview with Sage.
About
MiniVAN is a tool for the exploration of small and large networks, addressed to social scientists and everyone who is interested in graph analysis but has difficulties with graph mathematics. The challenge is to make sophisticated analytic techniques (clustering, spatializing, ranking, filtering, etc) available in a visual and user-friendly environment.
MiniVAN has several advantages over the existing software, but it’s key strength is a long-standing reflection on the conceptual basis of Visual Network Analysis. MiniVAN will not only offer a collection of analytic functions, but also guide it users aligning different visualisations and metrics in a ordered inquiry.
The development of MiniVAN will be uphold by a series of discussions with potential alpha-users, through the support of the Public Data Lab a research network on digital data and public interventions. The PLD gathers scholars coming from many leading digital methods centres from across Europe (both from the social and the information sciences). It also entertains a network of contacts with practitioners, journalists, civil society groups, designers, developers and public institutions, which will be mobilised to specify the different needs that MiniVAN will try to respond to.
MiniVAN is composed of two distinct open source web applications:
- The Analyser
- Receives and parses a graph uploaded by the user;
- Guides the user through the choice of the dimensions and the methods of the analysis;
- Accompanies the user in the definition of the visual properties of the graph representation;
- Produces a file bundle to be processed by the second application. (The file bundle produced by the Analyser can be hosted by any web server or by a third-party solutions – such as Github’s gists)
- The Visualiser
- Reads the data contained in the file bundle produced by the Analyser;
- Displays multiple visualizations of the network;
- Provides selected metrics and information about categories and relational structures;
- Allows the proposed views to be further filtered/tweaked/explored etc. by the readers;
- Generate a code snippet that can be embedded in any website.
A few readings on Visual Network Analysis:
- Venturini, Tommaso, Mathieu Jacomy, and Pablo Jensen. Extract from “What do we see when we look at networks an introduction to visual network analysis and force-directed layouts”, forthcoming
- Venturini, Tommaso, Mathieu Jacomy, Liliana Bounegru, and Jonathan Gray. 2018. “Visual Network Exploration for Data Journalists”. In The Routledge Handbook to Developments in Digital Journalism Studies, edited by Scott II Eldridge and Bob Franklin. Abingdon: Routledge.
- Jacomy, Mathieu, Tommaso Venturini, Sebastien Heymann, and Mathieu Bastian. 2014. “ForceAtlas2, a Continuous Graph Layout Algorithm for Handy Network Visualization Designed for the Gephi Software”. PloS One 9 (6): e98679. doi:10.1371/journal.pone.0098679.
- Venturini, Tommaso, Liliana Bounegru, Mathieu Jacomy, and Jonathan Gray. 2017. “How to Tell Stories with Networks: Exploring the Narrative Affordances of Graphs with the Iliad”. In Datafied Society, edited by Mirko Tobias Schäfer and Karin van Es. Amsterdam: University Press.
- Bounegru, Liliana, Tommaso Venturini, Jonathan Gray, and Mathieu Jacomy. 2017. “Narrating Networks”. Digital Journalism 5 (6): 699–730. doi:10.1080/21670811.2016.1186497.
- Venturini, Tommaso, Anders Munk, and Mathieu Jacomy. 2018. “Actor-Network VS Network Analysis VS Digital Networks Are We Talking About the Same Networks?”. In DigitalSTS: A Handbook and Fieldguide (Forthcoming), edited by David Ribes and Janet Vertesi.
The Data Journalism Handbook

The Data Journalism Handbook: Towards a Critical Data Practice (Amsterdam University Press, 2021) provides a rich and panoramic introduction to data journalism, combining both critical reflection and practical insight. It offers a diverse collection of perspectives on how data journalism is done around the world and the broader consequences of datafication in the news, serving as both a textbook and a sourcebook for this emerging field. With more than 50 chapters from leading researchers and practitioners of data journalism, it explores the work needed to render technologies and data productive for journalistic purposes. It also gives a ‘behind the scenes’ look at the social lives of datasets, data infrastructures, and data stories in newsrooms, media organizations, startups, civil society organizations and beyond. The book includes sections on ‘doing issues with data’, ‘assembling data’, ‘working with data’, ‘experiencing data’, ‘investigating data, platforms and algorithms’, ‘organizing data journalism’, ‘learning data journalism together’ and ‘situating data journalism’.
You can download an open access PDF of the book here (OAPEN) or here (King’s College London) and you can read more about the book in this blog post and on this Twitter thread.
Translations are available in Greek, Japanese, Portuguese.
To accompany the book there is an open access printable set of cards for the “twelve challenges for critical data practice”, as well as a repository of free/open source and open access resources for learning and doing data journalism. There’s also a chapter on critical data practices in Public Data Cultures (Polity, 2025).
Quotes about the book
“This is a stellar collection that spans applied and scholarly perspectives on practices of data journalism, rich with insights into the work of making data tell stories.”
– Kate Crawford, New York University“This stimulating new book offers researchers and journalists alike the welcome chance to reflect critically on how important new uses of quantification are inspiring what has become known as data journalism. The variety of voices, data, and examples are revelatory.”
– Wendy Espeland, Northwestern University“It is now established that data is entangled with politics and embedded in history and society. This bountiful book highlights the crucial role of data journalists as users and critics of data, and in facilitating public engagement and discussion around it.”
– Emmanuel Didier, Ecole normale supérieure“Profound and practical, this sparkling collection engages the topic of data journalism with rich insights into the nature of numbers in the news.”
– Geoffrey C. Bowker, University of California, Irvine“This book is an impressive feat. Bounegru and Gray have put together a truly global and diverse collection that greatly enriches our understanding of the politics of data and what it means for journalism. In the wake of the Covid-19 pandemic, this contribution is more important than ever.”
– Lina Dencik, Cardiff University“Ostensibly focused on data journalism, this handbook is so much more, providing an overarching analysis of much of the emerging field of critical data studies. Journalists and others interested in how to assemble, work with, make sense of, apply, and critically reflect on data and their uses will revel in the extensive theoretical and practical insights.”
– Rob Kitchin, Maynooth University“The Data Journalism Handbook is an indispensable resource for students, researchers, and journalists who want to understand how data are translated into information, information in knowledge and, ultimately, wisdom. That itinerary all starts with a full comprehension of how data reflect, construct and shape our social reality.”
– José van Dijck, Utrecht University“The variety, diversity, and depth of the contributions to this collective effort make this book a required reading for beginners and professionals alike.”
– Alberto Cairo, University of Miami“This magical multitudinous book is an experiment that will shape the future of critical data journalism.”
– Celia Lury, University of Warwick“By providing a wealth of living testimonies from practitioners and academics from different countries, this book gives a rich overview of practices that have become key in contemporary journalism. The main virtue of this book is to give a set of practical insights to help journalists not only to better cooperate with their peers but also to establish more fruitful relationships with researchers and publics.”
– Sylvain Parasie, Sciences Po“This wide-ranging and thoughtfully curated volume is an essential companion for researchers and practitioners who seek to rethink what data can mean for themselves and their audiences.”
– Yanni A. Loukissas, Georgia Tech“An intelligent and cutting-edge entry-point to the field of data journalism, sure to become an essential part of curricula and research around this topic.”
– Anja Bechmann, Aarhus University
Coverage
Tracing Public Facts
Prompted by Noortje Marres’s article “Why We Can’t Have Our Facts Back” this project explores different approaches for tracing and narrating “public facts” online.
Some explorations from a workshop on “A Digital Test of the News: Checking the Web for Public Facts” can be found here.
A Field Guide to “Fake News”

A Field Guide to “Fake News” and Other Information Disorders explores the use of digital methods to study false viral news, political memes, trolling practices and their social life online.
It responds to an increasing demand for understanding the interplay between digital platforms, misleading information, propaganda and viral content practices, and their influence on politics and public life in democratic societies.
It is a project of the Public Data Lab with support from First Draft.
The guide is freely available via the link below.
It is released under a Creative Commons Attribution license to encourage readers to freely copy, translate, redistribute and reuse the book. All the assets necessary to translate and publish the guide in other languages are available on the Public Data Lab’s GitHub page.
You can also find it on Zenodo here (DOI: 10.5281/zenodo.1136271).
Liliana Bounegru
Jonathan W. Y. Gray
Jonathan W. Y. Gray is Reader in Critical Infrastructure Studies at the Department of Digital Humanities, King’s College London; Co-Founder of the Public Data Lab; and Research Associate at the Digital Methods Initiative at the University of Amsterdam and the médialab at Sciences Po, Paris. More about his work can be found here. He is on Twitter at @jwyg.