Article on COVID-19 testing situations on Twitter published in Social Media + Society

An article on “Testing and Not Testing for Coronavirus on Twitter: Surfacing Testing Situations Across Scales With Interpretative Methods” has just been published in Social Media + Society, co-authored by Noortje MarresGabriele ColomboLiliana BounegruJonathan W. Y. Gray, Carolin Gerlitz and James Tripp, building on a series of workshops in Warwick, Amsterdam, St Gallen and Siegen.

The article explores testing situations – moments in which it is no longer possible to go on in the usual way – across scales during the COVID-19 pandemic through interpretive querying and sub-setting of Twitter data (“data teasing”), together with situational image analysis.

The full text is available open access here. Further details and links can be found at this project page. The abstract and reference are copied below.

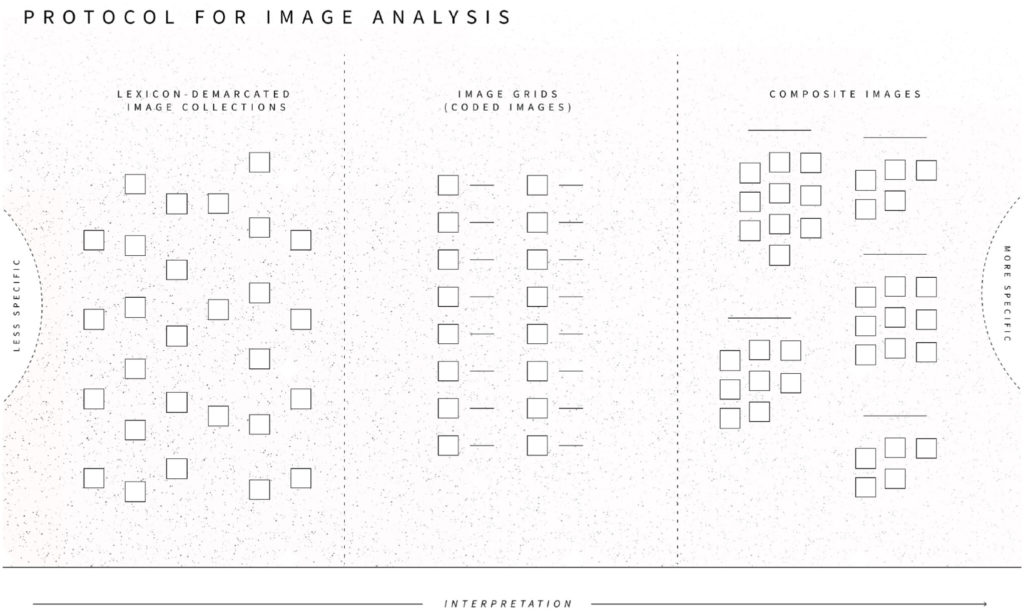
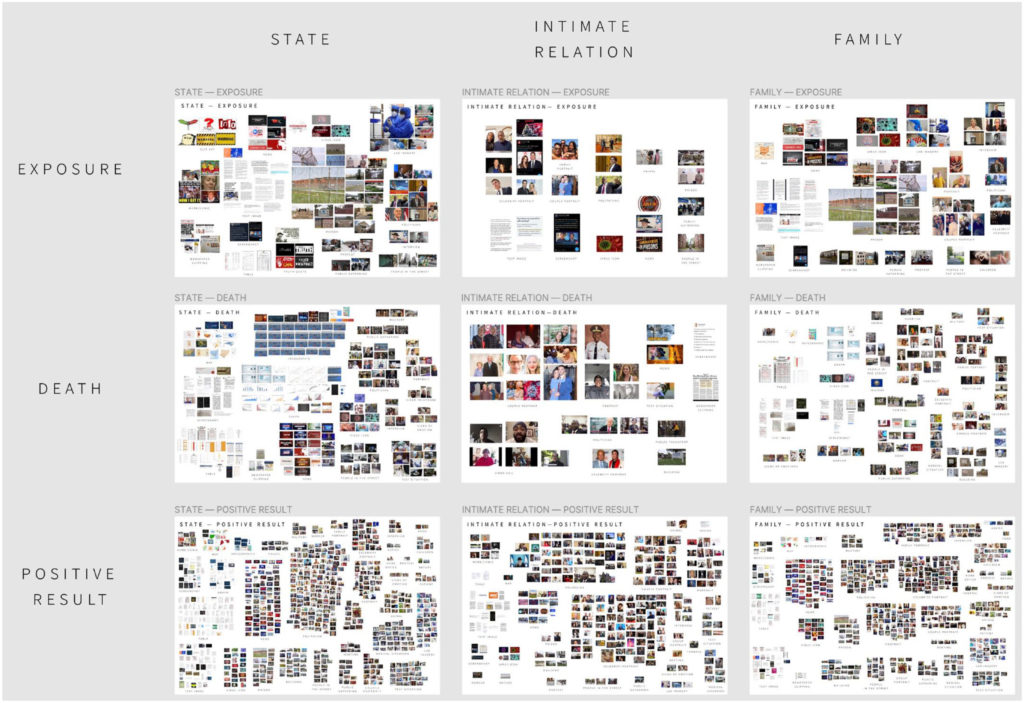
How was testing—and not testing—for coronavirus articulated as a testing situation on social media in the Spring of 2020? Our study examines everyday situations of Covid-19 testing by analyzing a large corpus of Twitter data collected during the first 2 months of the pandemic. Adopting a sociological definition of testing situations, as moments in which it is no longer possible to go on in the usual way, we show how social media analysis can be used to surface a range of such situations across scales, from the individual to the societal. Practicing a form of large-scale data exploration we call “interpretative querying” within the framework of situational analysis, we delineated two types of coronavirus testing situations: those involving locations of testing and those involving relations. Using lexicon analysis and composite image analysis, we then determined what composes the two types of testing situations on Twitter during the relevant period. Our analysis shows that contrary to the focus on individual responsibility in UK government discourse on Covid-19 testing, English-language Twitter reporting on coronavirus testing at the time thematized collective relations. By a variety of means, including in-memoriam portraits and infographics, this discourse rendered explicit challenges to societal relations and arrangements arising from situations of testing and not testing for Covid-19 and highlighted the multifaceted ways in which situations of corona testing amplified asymmetrical distributions of harms and benefits between different social groupings, and between citizens and state, during the first months of the pandemic.

Marres, N., Colombo, G., Bounegru, L., Gray, J. W. Y., Gerlitz, C., & Tripp, J. (2023). Testing and Not Testing for Coronavirus on Twitter: Surfacing Testing Situations Across Scales With Interpretative Methods. Social Media + Society, 9(3). https://doi.org/10.1177/20563051231196538

Network exploration on the web: an interview with Gephi Lite

Following the recent release of Gephi Lite, an open-source web-based visual network exploration tool, we interviewed its developers about the background of the project, what they’ve done and future plans…

What is Gephi Lite?

Gephi Lite can actually be defined in two ways. The first definition follows the name we chose: Gephi Lite is a lighter version of the Gephi desktop software, targeting users who need to work on smaller networks with less complex operations in mind.

The second definition is more focused on the technical context: Gephi Lite is a serverless web application to drive visual network analysis. There are no more requirements than an internet connection and a modern web browser.

Continue reading

Article on “Engaged research-led teaching: composing collective inquiry with digital methods and data”

A new article on “Engaged research-led teaching: composing collective inquiry with digital methods and data” co-authored by Jonathan GrayLiliana BounegruRichard RogersTommaso VenturiniDonato RicciAxel MeunierMichele MauriSabine NiedererNatalia Sánchez-QuerubínMarc TutersLucy Kimbell and Anders Kristian Munk has just been published in Digital Culture & Education.

The article is available here, and the abstract is as follows:

This article examines the organisation of collaborative digital methods and data projects in the context of engaged research-led teaching in the humanities. Drawing on interviews, field notes, projects and practices from across eight research groups associated with the Public Data Lab (publicdatalab.org), it provides considerations for those interested in undertaking such projects, organised around four areas: composing (1) problems and questions; (2) collectives of inquiry; (3) learning devices and infrastructures; and (4) vernacular, boundary and experimental outputs. Informed by constructivist approaches to learning and pragmatist approaches to collective inquiry, these considerations aim to support teaching and learning through digital projects which surface and reflect on the questions, problems, formats, data, methods, materials and means through which they are produced.

Make a deal with Gephisto

Mathieu Jacomy and Anders Munk, TANT Lab & Public Data Lab

6 minutes read

Make a deal with Gephisto

Gephisto is Gephi in one click. You give it network data, and it gives you a visualization. No settings. No skills needed. The dream! With a twist.

Gephisto produces visualizations such as the one above. It exists as a website, and you can just try it below. It includes test networks, you don’t even need one. Do it! Try it, and come back here. Then we talk about it.

https://jacomyma.github.io/gephisto/

Continue reading

Using ObservableHQ notebooks for gathering and transforming data in digital research

We’ve recently been experimenting with the use of ObservableHQ notebooks for gathering and transforming data in the context of digital research. This post walks through a few recent examples of notebooks from recent Public Data Lab projects.

In one project we wanted to use the CrowdTangle “Links” API to fetch data about how certain web pages were shared online and across different platforms. After gaining access to relevant end points, we could adopt different means to call the APIs and retrieve data: such as using something like Postman (a general-purpose interface to call endpoints), or writing custom scripts (for example in Python or Javascript).

Code notebooks are a third option that lies somewhere in between these options. Designed for programmers, notebooks allow for iterative manipulation and experimentation with code whilst keeping track of creative processes by commenting on the thinking behind each step.

Notebooks allow us to both write and run custom scripts as well as creating simple interfaces for those who may not code. Thus we can use them to help researchers, students and external collaborators to collect data, making it easier to call APIs, setting parameters, or perform manipulations.

ObservableHQ is one solution for writing programming notebooks, it runs in the browser and is oriented towards data and visualisations (“We believe thinking with data is an essential skill for the future”). Hence, we thought it could be a good starting point for what we wanted to do.

Screen capture of a notebook
Continue reading

New special issue of the bilingual journal Diseña on Visual Methods for Online Images

A new special issue of the bilingual journal Diseña has just been released. The issue, edited by Gabriele Colombo and Sabine Niederer, explores the realm of online images as a site for visual research and design.

While in an image-saturated society, methods for visual analysis gain urgency, this special issue explores visual ways to study online images. The proposition we make is to stay as close to the material as possible. How to approach the visual with the visual? What type of images may one design to make sense of, reshape, and reanimate online image collections? The special issue also touches upon the role that algorithmic tools, including machine vision, can play in such research efforts. Which kinds of collaborations between humans and machines can we envision to better grasp and critically interrogate the dynamics of today’s digital visual culture?

The articles (available both in English and in Spanish) touch on the diversity of formats and uses of online images, focusing on collection and visual interpretation methods. Other themes touched by this issue are image machine co-creation processes and their ethics, participatory actions for image production and analysis, and feminist approaches to digital visual work.

Further information about the issue can be found in our introduction. Following is the complete list of contributions (with links) and authors (some from the Public Data Lab).

Continue reading

Investigating infodemic – researchers, students and journalists work together to explore the online circulation of COVID-19 misinformation and conspiracies

Over the past year researchers and students at institutions associated with the Public Data Lab have contributed to a series of collaborative digital investigations into the online circulation of COVID-19 misinformation and conspiracies.

Researchers and students contributed to a series of “engaged research led teaching” projects developed with journalists, media organisations and non-governmental organisations around the world.

These were undertaken in association with the Arts and Humanities Research Council funded project Infodemic: Combatting COVID-19 Conspiracy Theories, which explores how digital methods grounded in social and cultural research may facilitate understanding of WHO has described as an “infodemic” of misleading, fabricated, conspiratorial and other problematic material related to the COVID-19 pandemic.

These projects led to and contributed to a number of stories, investigations and publications including:

Continue reading

New edition of Data Journalism Handbook now open access with Amsterdam University Press

This blog is cross-posted from lilianabounegru.org. Further details can be found in this thread.

Today The Data Journalism Handbook: Towards a Critical Data Practice (which I co-edited with Jonathan Gray) is published on Amsterdam University Press. It is published as part of a new book series on Digital Studies which is also being launched today. You can find the book here, including an open access version: http://bit.ly/data-journalism-handbook-2

The book provides a wide-ranging collection of perspectives on how data journalism is done around the world. It is published a decade after the first edition (available in 14 languages) began life as a collaborative draft at the Mozilla Festival 2011 in London.

Book sprint at MozFest 2011 for first edition of Data Journalism Handbook.

The new edition, with 54 chapters from 74 leading researchers and practitioners of data journalism, gives a “behind the scenes” look at the social lives of datasets, data infrastructures, and data stories in newsrooms, media organizations, startups, civil society organizations and beyond.

The book includes chapters by leading researchers around the world and from practitioners at organisations including Al Jazeera, BBC, BuzzFeed News, Der Spiegel, eldiario.es, The Engine Room, Global Witness, Google News Lab, Guardian, the International Consortium of Investigative Journalists (ICIJ), La Nacion, NOS, OjoPúblico, Rappler, United Nations Development Programme and the Washington Post.

An online preview of various chapters from book was launched in collaboration with the European Journalism Centre and the Google News Initiative and can be found here.

The book draws on over a decade of professional and academic experience engaging with the field of data journalism, including through my role as Data Journalism Programme Lead at the European Journalism Centre; my research on data journalism with the Digital Methods Initiative; my PhD research on “news devices” at the universities of Groningen and Ghent; and my research, teaching and collaborations around data journalism at the Department of Digital Humanities at King’s College London.

Further background about the book can be found in our introduction. Following is the full table of contents and some quotes about the book. We’ll be organising various activities around the book in coming months, which you can follow with the #ddjbook hashtag on Twitter.

If you adopt the book for a class we’d love to hear from you so we can keep track of how it is being used (and also update this list of data journalism courses and programmes around the world) and to inform future activities in this area. Hope you enjoy it!

Continue reading