The first of a two-part series providing critical considerations for reporting on environmental issues with social media data
By Thais Lobo, Rina Tsubaki, Liliana Bounegru, Jonathan Gray and Gabriele Colombo
Social media platforms and online services can reveal how forests, rivers, mountains, animals — and human encounters with them — are seen, valued, and contested in near real-time. This isn’t without its challenges. Online platforms shape what we see and whose voices are amplified. While they can’t be treated as neutral reflections of how we relate to the environment, when taken as indications rather than comprehensive or unbiased sources, they can be useful leads for climate reporting.
This piece is the first of a two-part series with critical considerations for climate data journalists interested in how online activity about environmental issues can reveal new story angles and generate evidence to support on-the-ground reporting. This first piece focuses on practical tips for searching and analysing digital data, while the second explores how to add depth and context to those online findings.
The checklist series draws on findings from our research on online engagement with forest restoration, carried out as part of the EU-funded SUPERB project. As part of the project, we looked at online activity across five digital platforms linked to twelve European forest sites where SUPERB is working on ecological restoration. The insights gathered here aim to support climate reporting with and about digital platforms, considering both the opportunities and limitations these sources offer to journalists.
We are pleased to announce the 3rd edition of the Summer School in Digital Methods for Critical Consumer Studies, which will take place in Como – from September 22 to 26, 2025.
This year’s theme is: Artificial intelligence as a methodological resource and its applications for consumer culture research.
The School will focus on the intersection between Digital Methods, consumer culture, and AI technologies such as large language models (LLMs), exploring both technical and critical perspectives. The School is meant for master and PhD students who wish to learn digital methods and apply them to their research project in the field of consumer culture. The programme includes lectures, workshops, keynote talks, and group work, delivered by an international and interdisciplinary faculty. Confirmed keynote speakers are: Joonas Rokka (Emlyon Business School), Giorgia Aiello (University of Milan) and Gabriele Colombo (Politecnico di Milano). The Summer School is organized by the University of Milan, in collaboration with: SOMET – PhD Programme in Sociology and Methodology of Social Research, Milan School of Media and Communication, PhD in Communication Science and Practice, University of Pavia.
Applications are open until June 6, 2025
To participate in the Summer School, candidates must send their applications at this email address: laura.bruschi@unimi.it, by 6 June 2025. Applications must entail a CV and presentation letter, containing: a) brief bio; b) interests of research; c) motivation to participate in the Summer School.
We welcome applications from MA and PhD students, early-career researchers, and professionals interested in digital methods, AI, media, and consumer studies.
Please feel free to share this call with colleagues or students who might be interested.
Best regards,
On behalf of the School Directors: A. Caliandro, A. Gandini, M. Airoldi
Memespector-GUI has helped over a thousand researchers use well-known cloud-based computer vision APIs to enhance their image datasets since 2021. The last major version of Memespector-GUI was released about four years ago.
The developer of Memespector-GUI is considering continuing the development of the tool. He would like to invite former, current, and potential future users to share your feedback on the current version, as well as your ideas for the next generation of the tool.
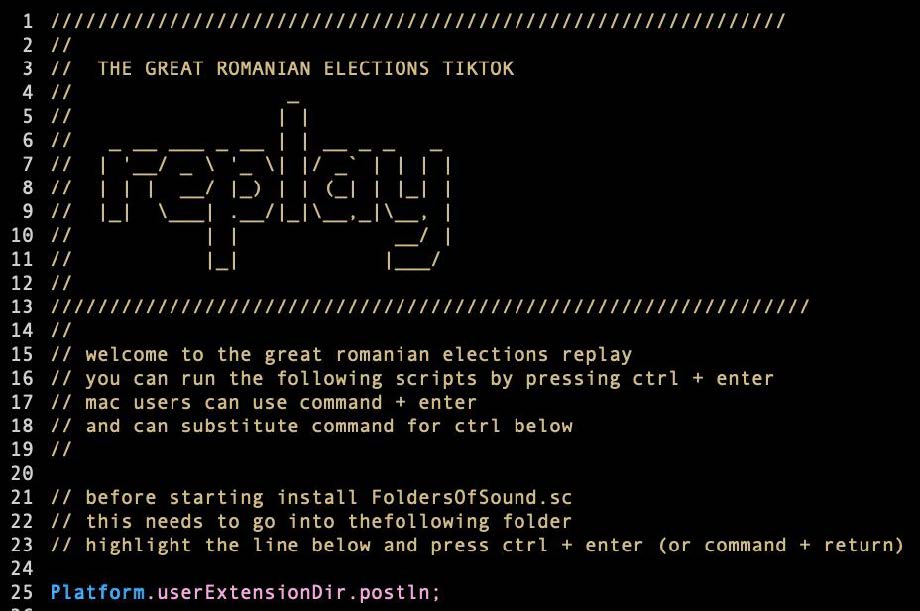
In January 2025 a group of us met at the Digital Methods Winter School at the University of Amsterdam to explore how TikTok was used during and after the elections.
We explored ways of playing back election TikTok video collections to understand what happened.
We experimented with formats for retrospective display – drawing inspiration from creative coding, algorithmic composition, multiperspective live action replays, and the aesthetics of forensic reconstruction.
Following research on visual methods for studying folders of images (Niederer and Colombo, 2024; Colombo, Bounegru & Gray, 2023) and analytical metapicturing (Rogers, 2021), these formats display multiple videos simultaneously to surface patterns and resonances across them.
Beyond evaluating informational content, group replay formats can also highlight the everyday situations, aesthetics and affective dimensions of election TikTok videos – from sexualised lip-syncing to rousing AI anthems, sponsored micro-influencer testimonials to post-communist nationalist nostalgia.
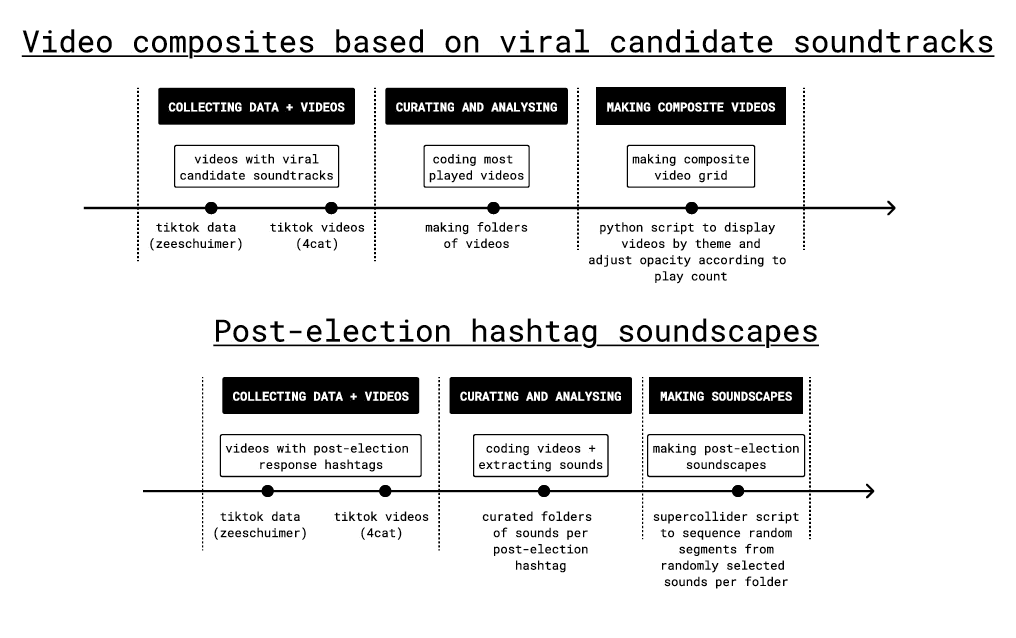
We explored two approaches for critically replaying Romanian election videos: making video composites based on viral candidate soundtracks, and making post-election hashtag soundscapes. For the former we used a Python script to display videos by theme and adjust opacity according to play count. For the latter we used soundscaping scripts developed as part of the Forestscapes project.
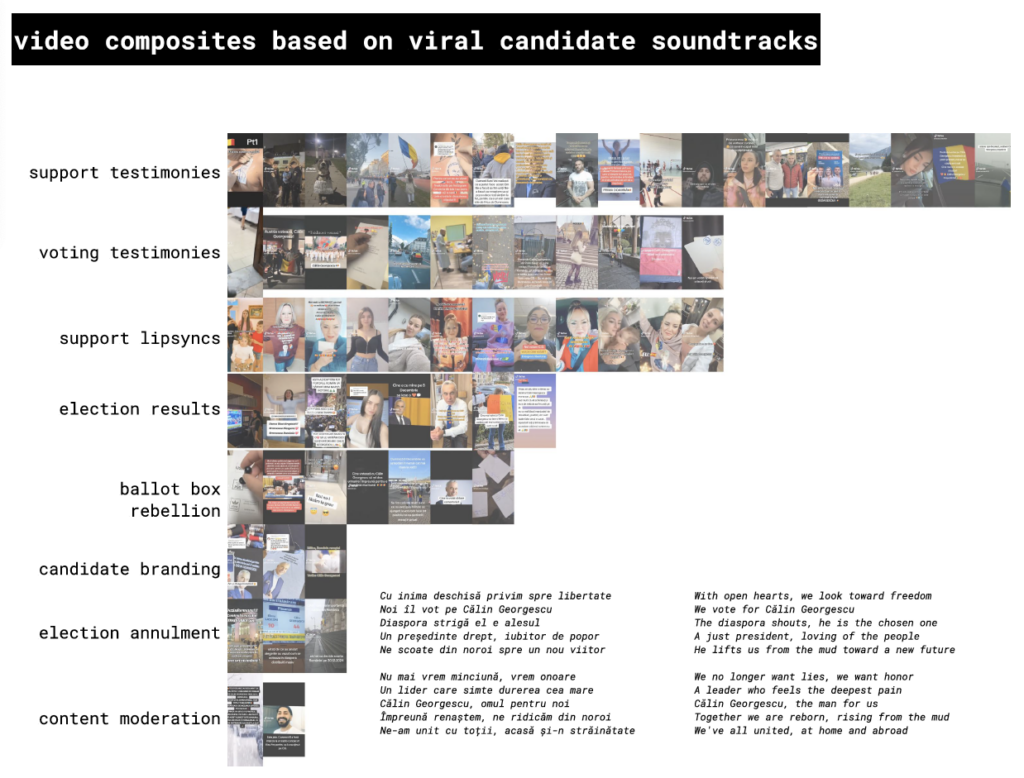
For the video composites we used as case studies two viral soundtracks associated with ultranationalist Călin Georgescu and the centre-right, pro-EU, Save Romania Union candidate Elena Lasconi.
Our preliminary findings indicate that successful pro-Georgescu propaganda using the “SustinCalin Georgescu” soundtrack relies on memetic imitation of the message and affective resonances of the song. TikTok influencers and everyday users translate these into popular formats such as lipsyncs and ASMR videos effectively blending textual, visual, and audio elements.
Gender, sexuality and race are prominent themes in the most engaged with propagandist videos for both campaigns. In pro-Georgescu content, popular endorsement videos often feature white women in either sexualised roles or domestic family settings. Homophobic and transphobic videos with male characters in dresses parody the opponent’s and her party’s association with LGBTQ issues, fuelling the audience’s strong emotions towards minoritised groups.
For the “Hai Lasconi la Putere” propagandistic song, the most significant finding is its successful appropriation for counter-propaganda to spread racist, sexist, homophobic, and transphobic content targeting minoritised groups. These videos do not only target Lasconi but more worryingly these groups themselves, amplifying fears and prejudices, as often reflected in the comments.
The second technique we explored was post-election hashtag soundscaping. We examined hashtags such as: #anularealegeri, #aparamdemocratia, #calingeorgescupresedinte, #cg, #cinetaceestecomplice #demisiaccr, #demisiaiohanis, #lovituradestat, #romaniatacuta, #romaniavanduta, #stegarul, #stegaruldac and #votfurat.
For example, in the #stegaruldac soundscape the simultaneous replay of TikTok video soundtracks associated with this hashtag enables a synthetic mode of attending not only to the content of propaganda but also to the various settings in which propaganda unfolds in everyday life (e.g. in the home and on the street) as well as associated affective atmospheres.
You can explore our project poster and some of our video composites and soundscapes here.
This roundtable fosters dialogue about the current state of digital methods for Internet research in Brazil. We seek to celebrate emerging research practices and kick off a Global South network, situating them within a transitional methodological moment in which digital methods and methodologies have been built with, in and about AI, web platforms and data visualisation. This roundtable does not provide an exhaustive overview of digital methods in Brazil. Instead, it focuses on approaches specifically developed within the Brazilian context, offering unique perspectives on the field. 🇧🇷
🔗You are welcome to join the Digital Methods Global South Network by collaborating with us to map Digital Methods in Brazil (click here!) The results of this form will be displayed here and updated continuously 🤓.
How are digital objects such as hashtags, links, likes and images involved in the production of forest politics? This chapter explores this through collaborative research on the dynamics of online engagement with the 2019 Amazon forest fires. Through a series of empirical vignettes with visual materials and data from social media, we examine how digital platforms, objects and devices perform and organise relations between forests and a wide variety of societal actors, issues, cultures – from bots to boycotts, agriculture to eco-activism, scientists to pop stars, indigenous communities to geopolitical interventions. Looking beyond concerns with the representational (in-)fidelities of forest media, we consider the role of collaborative methodological experiments with co-hashtag networks, cross-platform analysis, composite images and image-text variations in tracing, eliciting and unfolding the digital mediation of ecological politics. Thinking along with research on the social lives of methods, we consider the role of digital data, methods and infrastructures in the composition and recomposition of problems, relations and ontologies of forests in society.
Here’s the book blurb:
Digital ecologies draws together leading social science and humanities scholars to examine how digital media are reshaping the futures of conservation, environmentalism, and ecological politics. The book offers an overview of the emerging field of interdisciplinary digital ecologies research by mapping key debates and issues in the field, with original empirical chapters exploring how livestreams, sensors, mobile technologies, social media platforms, and software are reconfiguring life in profound ways. The collection traverses contexts ranging from animal exercise apps, to surveillance systems on the high seas, and is organised around the themes of encounters, governance, and assemblages. Digital ecologies also includes an agenda-setting intervention by the book’s editors, and three closing chapter-length provocations by leading scholars in digital geographies, the environmental humanities, and media theory that set out trajectories for future research.
The annual Digital Methods Winter School in Amsterdam will take place on 6-10th January 2025 with the theme “Chatbots and LLMs for Internet Research?”. The deadline for applications is 9 December 2024. You can read more on this page (an excerpt from which is copied below).
The Digital Methods Initiative (DMI), Amsterdam, is holding its annual Winter School on ‘Chatbots for Internet Research?’. The format is that of a (social media and web) data sprint, with tutorials as well as hands-on work for telling stories with data. There is also a programme of keynote speakers. It is intended for advanced Master’s students, PhD candidates and motivated scholars who would like to work on (and complete) a digital methods project in an intensive workshop setting. For a preview of what the event is like, you can view short video clips from previous editions of the School.Chatbots and LLMs for Internet Research? Towards a Reflexive ApproachPositions now are increasingly staked out in the debate concerning the application of chatbots and LLMs to social and cultural research. On the one hand there is the question of ‘automating’ methods and shifting some additional part of the epistemological burden to machines. On the other there is the rejoinder that chatbots may well be adequate research buddies, assisting with (among other things) burdensome and repetitive tasks such as coding and annotating data sets. They seem to be continually improving, or at least growing in size and apparent promise. Researcher experiences are now widely reported: chatbots have outperformed human coders, ‘understanding’ rather nuanced stance-taking language and correctly labeling it better than average coders. But other work has found that the LLM labeling also has the tendency to be bland, given how the filters and safety guardrails (particularly in US-based chatbots) tend to depoliticise or otherwise soften their responses. As researcher experience with LLMs becomes more widely reported, there are user guides and best practices designed to make LLM findings more robust. Models should be carefully chosen, persona’s should be well developed, prompting should be conversational and so forth. LLM critique is also developing apace, with (comparative) audits interrogating underlying discrimination and bias that are only papered over by filters. At this year’s Digital Methods Winter School we will explore these research practices with chatbots and LLMs for internet research, with an emphasis on bringing them together. How to deploy and critique chatbots and LLMs at the same time, in a form of reflexive usage?
Applications: Key Dates
There are rolling admissions and applications are now being accepted. To apply please send a letter of motivation, your CV, a headshot photo and a 100-word bio to winterschool [at] digitalmethods.net. Notifications of acceptance are sent within 2 weeks after application. Final deadline for applications is 9 December 2024. The full program and schedule of the Winter School are available by 19 December 2024.
The @digitalmethods.net Winter School in Amsterdam will take place on 6-10th January 2025 with the theme “Chatbots and LLMs for Internet Research?”. Apply by 9th December. 📝✨ publicdatalab.org/2024/11/29/d… #digitalmethods
Zeeschuimer (“sea foamer”) is a web browser extension from the Digital Methods Initiative in Amsterdam that enables you to collect data while you are browsing social media sites for research and analysis.
It currently works for platforms such as TikTok, Instagram, Twitter and LinkedIn and provides an ndjson file which can be imported into the open source 4CAT: Capture and Analysis Toolkit for analysis.
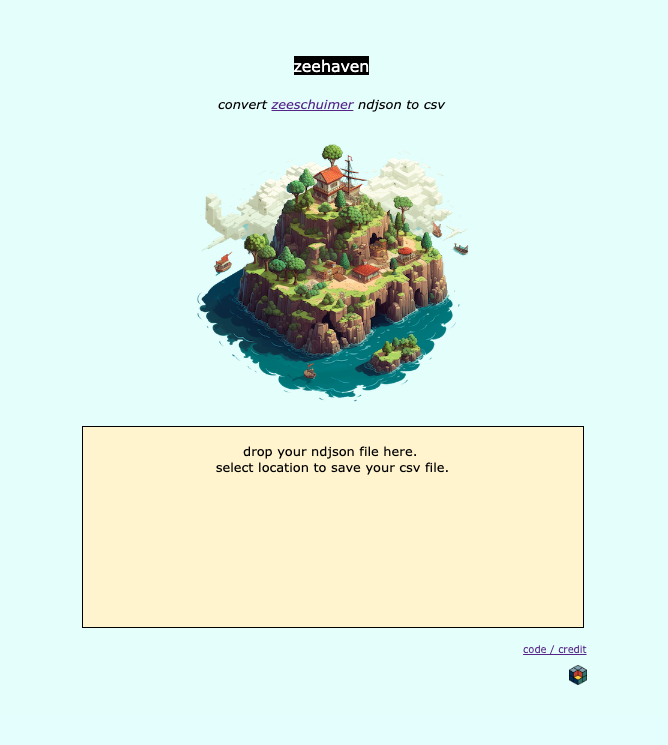
To make data gathered with Zeeschuimer more accessible for for researchers, reporters, students, and others to work with, we’ve created zeehaven (“sea port”) – a tiny web-based tool to convert ndjson into csv format, which is easier to explore with spreadsheets as well as common data analysis and visualisation software.
Drag and drop a ndjson file into the “sea port” and the tool will prompt you to save a csv file. ✨📦✨
Elon Musk’s takeover of Twitter has prompted confusion among its users and concerns about the platform’s future. Musk’s tweets are gathering daily attention due to large-scale layoffs and safety concerns around the new paid blue verification mark. To make things worse, as its engineers are on their way out of the door, users are also experiencing various technical glitches on the platform. Millions of users – including journalists, researchers and organisations – are already signing up on alternative platforms to be prepared for the platform’s deterioration and demise.
While no one can predict Twitter’s future, it remains widely used by politicians, scientists, companies, NGOs and influencers who are still busy posting on the platform. This includes COP27 in Egypt, where Twitter was one of the main platforms to report on the event. #cop27 has been tweeted over 2.85 million times since 5 November 2022.
Social media platforms can give us additional insights into how broader publics make connections between forest restoration and other social, economic and environmental issues. To see which issues and narratives around forest restoration have been brought up on Twitter in the lead-up to the event, we’ve carried out a series of small explorations based on the digital methods recipes developed by our colleagues at the Department of Digital Humanities, King’s College London and the Public Data Lab who are part of the SUPERB consortium led by EFI. This has been a good way to see if EFI could use these methods independently to understand international events as they unfold.
We usually see a spike in hashtag usage a few days before global events like the COPs. Using#cop27, we collected 217,189 tweets between 5 and 7 November 2022. We then examined the top 1000 hashtags to see which kinds of forest-related issues are present.
This will take place on 9-13th January 2023 at the University of Amsterdam. Applications are accepted until 1st December 2022.
More details and registration links are available here and an excerpt on this year’s theme and the format is copied below:
The Digital Methods Initiative (DMI), Amsterdam, is holding its annual Winter School on the ‘Use and Misuse of Open Source Intelligence (OSINT)’. The format is that of a (social media and web) data sprint, with tutorials as well as hands-on work for telling stories with data. There is also a programme of keynote speakers. It is intended for advanced Master’s students, PhD candidates and motivated scholars who would like to work on (and complete) a digital methods project in an intensive workshop setting. For a preview of what the event is like, you can view short video clips from previous editions of the School.