Networks are increasingly popular in the social sciences and in the humanities as interfaces for exploratory data analysis. “Visual Networks Analysis” (or VNA) allows scholars to analyse large relational datasets without having to deal with the full complexity of graph mathematics.
Current VNA tools, however, are either too complicated or unable to handle large datasets. Hence MiniVAN, a VNA tool, accessible to scholars with little knowledge of mathematics or coding and yet capable to scale up to graphs of several thousands of nodes.
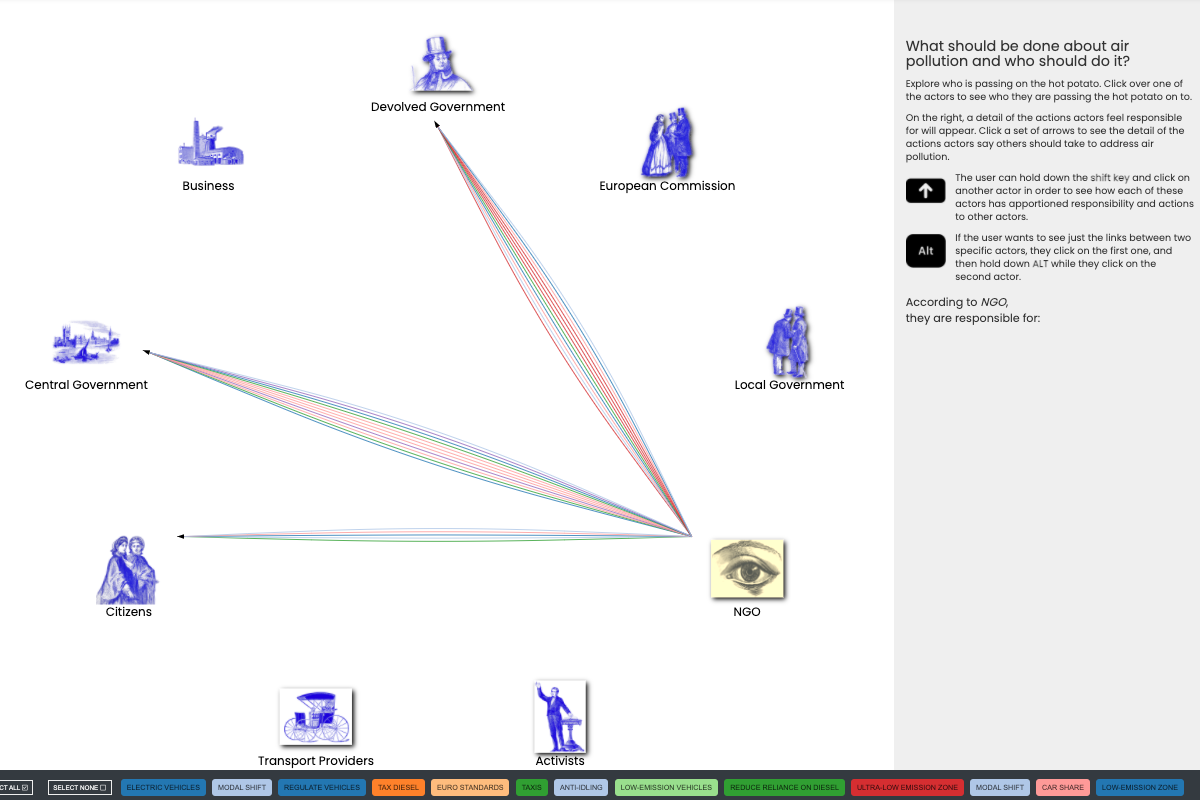
MiniVAN draws on previous open source (gephi.org, sigmajs.org, graphology.github.io) and research projects (climaps.eu and fakenews.publicdatalab.org).
MiniVAN is a project of the Public Data Lab with support from Sage Ocean Concept Grant.
You can read more about the project in this interview with Sage.
About
MiniVAN is a tool for the exploration of small and large networks, addressed to social scientists and everyone who is interested in graph analysis but has difficulties with graph mathematics. The challenge is to make sophisticated analytic techniques (clustering, spatializing, ranking, filtering, etc) available in a visual and user-friendly environment.
MiniVAN has several advantages over the existing software, but it’s key strength is a long-standing reflection on the conceptual basis of Visual Network Analysis. MiniVAN will not only offer a collection of analytic functions, but also guide it users aligning different visualisations and metrics in a ordered inquiry.
The development of MiniVAN will be uphold by a series of discussions with potential alpha-users, through the support of the Public Data Lab a research network on digital data and public interventions. The PLD gathers scholars coming from many leading digital methods centres from across Europe (both from the social and the information sciences). It also entertains a network of contacts with practitioners, journalists, civil society groups, designers, developers and public institutions, which will be mobilised to specify the different needs that MiniVAN will try to respond to.
MiniVAN is composed of two distinct open source web applications:
- The Analyser
- Receives and parses a graph uploaded by the user;
- Guides the user through the choice of the dimensions and the methods of the analysis;
- Accompanies the user in the definition of the visual properties of the graph representation;
- Produces a file bundle to be processed by the second application. (The file bundle produced by the Analyser can be hosted by any web server or by a third-party solutions – such as Github’s gists)
- The Visualiser
- Reads the data contained in the file bundle produced by the Analyser;
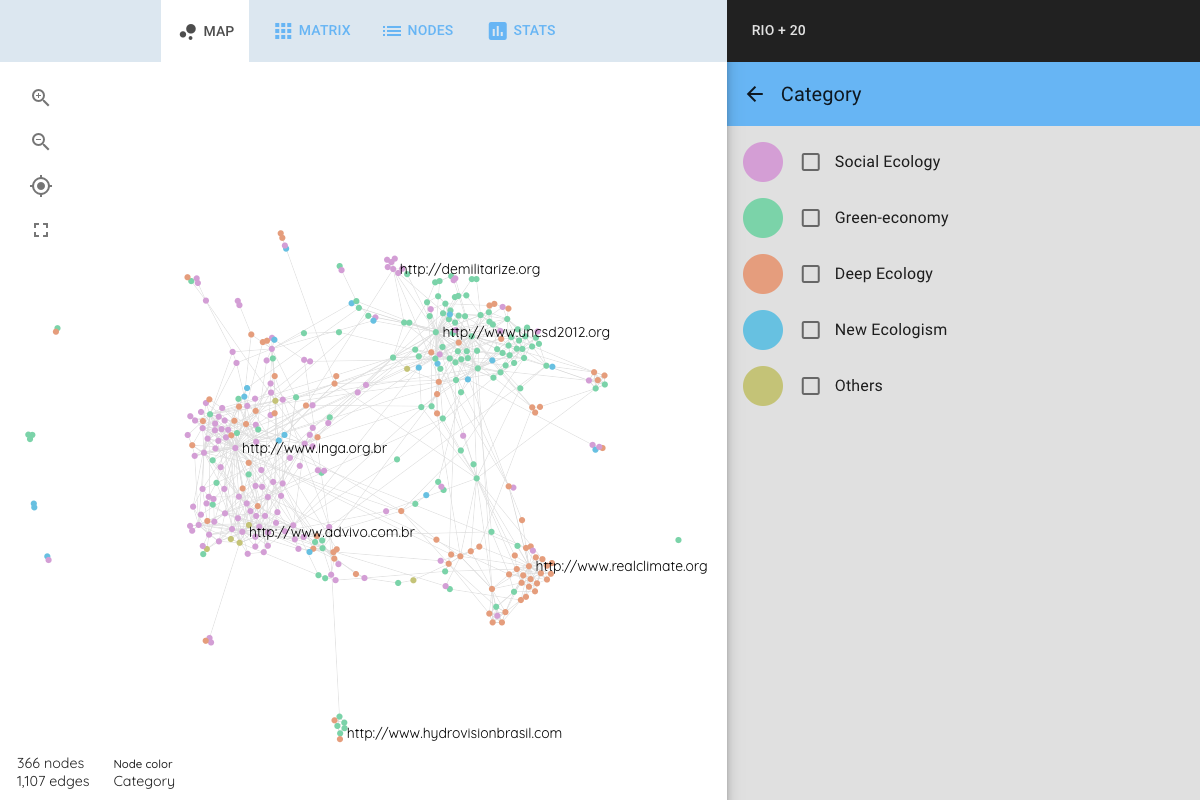
- Displays multiple visualizations of the network;
- Provides selected metrics and information about categories and relational structures;
- Allows the proposed views to be further filtered/tweaked/explored etc. by the readers;
- Generate a code snippet that can be embedded in any website.
A few readings on Visual Network Analysis:
- Venturini, Tommaso, Mathieu Jacomy, and Pablo Jensen. Extract from “What do we see when we look at networks an introduction to visual network analysis and force-directed layouts”, forthcoming
- Venturini, Tommaso, Mathieu Jacomy, Liliana Bounegru, and Jonathan Gray. 2018. “Visual Network Exploration for Data Journalists”. In The Routledge Handbook to Developments in Digital Journalism Studies, edited by Scott II Eldridge and Bob Franklin. Abingdon: Routledge.
- Jacomy, Mathieu, Tommaso Venturini, Sebastien Heymann, and Mathieu Bastian. 2014. “ForceAtlas2, a Continuous Graph Layout Algorithm for Handy Network Visualization Designed for the Gephi Software”. PloS One 9 (6): e98679. doi:10.1371/journal.pone.0098679.
- Venturini, Tommaso, Liliana Bounegru, Mathieu Jacomy, and Jonathan Gray. 2017. “How to Tell Stories with Networks: Exploring the Narrative Affordances of Graphs with the Iliad”. In Datafied Society, edited by Mirko Tobias Schäfer and Karin van Es. Amsterdam: University Press.
- Bounegru, Liliana, Tommaso Venturini, Jonathan Gray, and Mathieu Jacomy. 2017. “Narrating Networks”. Digital Journalism 5 (6): 699–730. doi:10.1080/21670811.2016.1186497.
- Venturini, Tommaso, Anders Munk, and Mathieu Jacomy. 2018. “Actor-Network VS Network Analysis VS Digital Networks Are We Talking About the Same Networks?”. In DigitalSTS: A Handbook and Fieldguide (Forthcoming), edited by David Ribes and Janet Vertesi.
