zeehaven – a tiny tool to convert data for social media research

Zeeschuimer (“sea foamer”) is a web browser extension from the Digital Methods Initiative in Amsterdam that enables you to collect data while you are browsing social media sites for research and analysis.

It currently works for platforms such as TikTok, Instagram, Twitter and LinkedIn and provides an ndjson file which can be imported into the open source 4CAT: Capture and Analysis Toolkit for analysis.

To make data gathered with Zeeschuimer more accessible for for researchers, reporters, students, and others to work with, we’ve created zeehaven (“sea port”) – a tiny web-based tool to convert ndjson into csv format, which is easier to explore with spreadsheets as well as common data analysis and visualisation software.

Drag and drop a ndjson file into the “sea port” and the tool will prompt you to save a csv file. ✨📦✨

zeehaven was created as a collaboration between the Centre for Interdisciplinary Methodologies, University of Warwick and Department of Digital Humanities, King’s College London – and grew out of a series of Public Data Lab workshops to exchange digital methods teaching resources earlier this year.

You can find the tool here and the code here. All data is converted locally.

Article on COVID-19 testing situations on Twitter published in Social Media + Society

An article on “Testing and Not Testing for Coronavirus on Twitter: Surfacing Testing Situations Across Scales With Interpretative Methods” has just been published in Social Media + Society, co-authored by Noortje MarresGabriele ColomboLiliana BounegruJonathan W. Y. Gray, Carolin Gerlitz and James Tripp, building on a series of workshops in Warwick, Amsterdam, St Gallen and Siegen.

The article explores testing situations – moments in which it is no longer possible to go on in the usual way – across scales during the COVID-19 pandemic through interpretive querying and sub-setting of Twitter data (“data teasing”), together with situational image analysis.

The full text is available open access here. Further details and links can be found at this project page. The abstract and reference are copied below.

How was testing—and not testing—for coronavirus articulated as a testing situation on social media in the Spring of 2020? Our study examines everyday situations of Covid-19 testing by analyzing a large corpus of Twitter data collected during the first 2 months of the pandemic. Adopting a sociological definition of testing situations, as moments in which it is no longer possible to go on in the usual way, we show how social media analysis can be used to surface a range of such situations across scales, from the individual to the societal. Practicing a form of large-scale data exploration we call “interpretative querying” within the framework of situational analysis, we delineated two types of coronavirus testing situations: those involving locations of testing and those involving relations. Using lexicon analysis and composite image analysis, we then determined what composes the two types of testing situations on Twitter during the relevant period. Our analysis shows that contrary to the focus on individual responsibility in UK government discourse on Covid-19 testing, English-language Twitter reporting on coronavirus testing at the time thematized collective relations. By a variety of means, including in-memoriam portraits and infographics, this discourse rendered explicit challenges to societal relations and arrangements arising from situations of testing and not testing for Covid-19 and highlighted the multifaceted ways in which situations of corona testing amplified asymmetrical distributions of harms and benefits between different social groupings, and between citizens and state, during the first months of the pandemic.

Marres, N., Colombo, G., Bounegru, L., Gray, J. W. Y., Gerlitz, C., & Tripp, J. (2023). Testing and Not Testing for Coronavirus on Twitter: Surfacing Testing Situations Across Scales With Interpretative Methods. Social Media + Society, 9(3). https://doi.org/10.1177/20563051231196538

Exploring forest hashtags in COP27 Twitter with the European Forest Institute

The following is a cross-post from Rina Tsubaki at the European Forest Institute, drawing on digital methods recipes and approaches developed with the Public Data Lab as part a broader collaboration around the SUPERB project on upscaling forest restoration.

Elon Musk’s takeover of Twitter has prompted confusion among its users and concerns about the platform’s future. Musk’s tweets are gathering daily attention due to large-scale layoffs and safety concerns around the new paid blue verification mark. To make things worse, as its engineers are on their way out of the door, users are also experiencing various technical glitches on the platform. Millions of users – including journalists, researchers and organisations – are already signing up on alternative platforms to be prepared for the platform’s deterioration and demise.

While no one can predict Twitter’s future, it remains widely used by politicians, scientists, companies, NGOs and influencers who are still busy posting on the platform. This includes COP27 in Egypt, where Twitter was one of the main platforms to report on the event. #cop27 has been tweeted over 2.85 million times since 5 November 2022. 

Social media platforms can give us additional insights into how broader publics make connections between forest restoration and other social, economic and environmental issues. To see which issues and narratives around forest restoration have been brought up on Twitter in the lead-up to the event, we’ve carried out a series of small explorations based on the digital methods recipes developed by our colleagues at the Department of Digital Humanities, King’s College London and the Public Data Lab who are part of the SUPERB consortium led by EFI. This has been a good way to see if EFI could use these methods independently to understand international events as they unfold.

We usually see a spike in hashtag usage a few days before global events like the COPs. Using #cop27we collected 217,189 tweets between 5 and 7 November 2022. We then examined the top 1000 hashtags to see which kinds of forest-related issues are present. 

Continue reading

“Data critique and platform dependencies: How to study social media data?”, Digital Methods Winter School and Data Sprint 2022

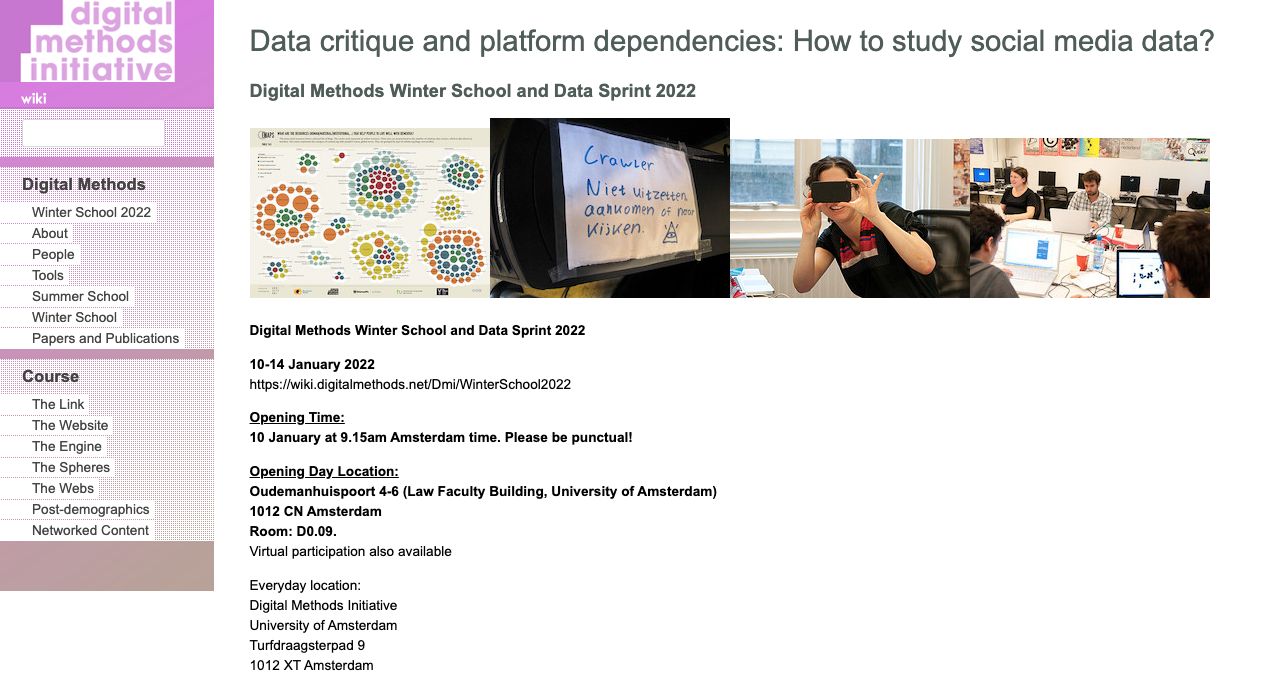
Applications are now open for the Digital Methods Winter School and Data Sprint 2022 which is on the theme of “Data critique and platform dependencies: How to study social media data?“.

This will take place on 10-14th January 2022 at the University of Amsterdam.

More details and registration links are available here and an excerpt on this year’s theme and the format is copied below.

The Digital Methods Initiative (DMI), Amsterdam, is holding its annual Winter School on ‘Social media data critique’. The format is that of a (social media and web) data sprint, with tutorials as well as hands-on work for telling stories with data. There is also a programme of keynote speakers. It is intended for advanced Master’s students, PhD candidates and motivated scholars who would like to work on (and complete) a digital methods project in an intensive workshop setting. For a preview of what the event is like, you can view short video clips from previous editions of the School.

Data critique and platform dependencies: How to study social media data?

Source criticism is the scholarly activity traditionally concerned with provenance and reliability. When considering the state of social media data provision such criticism would be aimed at what platforms allow researchers to do (such as accessing an API) and not to do (scrape). It also would consider whether the data returned from querying is ‘good’, meaning complete or representative. How do social media platforms fare when considering these principles? How to audit or otherwise scrutinise social media platforms’ data supply?

Recently Facebook has come under renewed criticism for its data supply through the publication of its ‘transparency’ report, Widely Viewed Content. It is a list of web URLs and Facebook posts that receive the greatest ‘reach’ on the platform when appearing on users’ News Feeds. Its publication comes on the heels of Facebook’s well catalogued ‘fake news problem’, first reported in 2016 as well as a well publicised Twitter feed that lists the most-engaged with posts on Facebook (using Crowdtangle data). In both instances those contributions, together with additional scholarly work, have shown that dubious information and extreme right-wing content are disproportionately interacted with. Facebook’s transparency report, which has been called ‘transparency theater’, demonstrates that it is not the case. How to check the data? For now, “all anybody has is the company’s word for it.”

For Facebook as well as a variety of other platforms there are no public archives. Facebook’s data sharing model is one of an industry-academic ‘partnership’. The Social Science One project, launched when Facebook ended access to its Pages API, offers big data — “57 million URLs, more than 1.7 trillion rows, and nearly 40 trillion cell values, describing URLs shared more than 100 times publicly on Facebook (between 1/1/2017 and 2/28/2021).” To obtain the data (if one can handle it) requires writing a research proposal and if accepted compliance with Facebook’s ‘onboarding’, a non-negotiable research data agreement. Ultimately, the data is accessed (not downloaded) in a Facebook research environment, “the Facebook Open Research Tool (FORT) … behind a VPN that does not have access to the Internet”. There are also “regular meetings Facebook holds with researchers”. A data access ethnography project, not so unlike to one written about trying to work with Twitter’s archive at the Library of Congress, may be a worthwhile undertaking.

Other projects would evaluate ‘repurposing’ marketing data, as Robert Putnam’s ‘Bowling Alone’ project did and as is a more general digital methods approach. Comparing multiple marketing data outputs may be of interest, and crossing those with CrowdTangle ‘s outputs. Facepager, one of the last pieces of software (after Netvizz and Netlytic) to still have access to Facebook’s graph API reports that “access permissions are under heavy reconstruction”. Its usage requires further scrutiny. There is also a difference between the user view and the developer view (and between ethnographic and computational approaches), which is also worth exploring. ‘Interface methods‘ may be useful here. These and other considerations for developing social media data criticism are topics of interest for this year’s Winter School theme.

At the Winter School there are the usual social media tool tutorials (and the occasional tool requiem), but also continued attention to thinking through and proposing how to work with social media data. There are also empirical and conceptual projects that participants work on. Projects from the past Summer and Winter Schools include: Detecting Conspiratorial Hermeneutics via Words & Images, Mapping the Dutchophone Fringe on Telegram, Greenwashing, in_authenticity & protest, Searching constructive/authentic posts in media comment sections: NU.nl/The Guardian, Mapping deepfakes with digital methods and visual analytics, “Go back to plebbit”: Mapping the platform antagonism between 4chan and Reddit, Profiling Bolsobots Networks, Infodemic everywhere, Post-Trump Information Ecology, Streams of Conspirational Folklore, and FIlterTube: Investigating echo chambers, filter bubbles and polarization on YouTube.

Organisers: Lucia Bainotti, Richard Rogers and Guillen Torres, Media Studies, University of Amsterdam. Application information at https://www.digitalmethods.net.

Continue reading

Investigating infodemic – researchers, students and journalists work together to explore the online circulation of COVID-19 misinformation and conspiracies

Over the past year researchers and students at institutions associated with the Public Data Lab have contributed to a series of collaborative digital investigations into the online circulation of COVID-19 misinformation and conspiracies.

Researchers and students contributed to a series of “engaged research led teaching” projects developed with journalists, media organisations and non-governmental organisations around the world.

These were undertaken in association with the Arts and Humanities Research Council funded project Infodemic: Combatting COVID-19 Conspiracy Theories, which explores how digital methods grounded in social and cultural research may facilitate understanding of WHO has described as an “infodemic” of misleading, fabricated, conspiratorial and other problematic material related to the COVID-19 pandemic.

These projects led to and contributed to a number of stories, investigations and publications including:

Continue reading